Illustrative examples · 54 processes · four maturity levels
How to improve
Every sample process in the PFV library, run through the same four maturity levels — with the methods used at each step and the days each one removed. Nothing here is a case study. It is a worked demonstration of what the method does and roughly what it is worth, so you can see the shape before you point it at your own work.
Before you buy more people, technology, or services — do you know how effectively your existing resources are being converted into outcomes?
PFV shows where an investment would actually improve capacity, flow, throughput or exposure — and where it would not.
What the improvement actually returned
Read this before the tables below, because the tables report lead time and lead time is the least of what changed. Removing a wait returns one of three things, and they are not interchangeable.
Return
Across the 42 worked processes
What it lets you claim
Capacity fewer hours per outcome
463 hours of hands-on work eliminated — 579 h down to 116 h. That is 58 days of the 610-day reduction: under a tenth.
The same people finish more work in a year. This is the only one of the three that does that.
Flow each item moves faster
552 days — the remaining nine tenths. Lead time fell from 809 days to 199 across the library.
Each item finishes sooner, and cash or value arrives sooner. Not more items, unless something was flow-limiting completions.
Exposure open for less time
The same 552 days, counted differently: every condition stayed open 75% less time.
Risk falls at identical volume. For a vulnerability or an unsigned contract this is the product.
And every hour of that 463 is rework that stopped happening. Not one mechanism made anybody faster at their job, and none removed a step that was doing useful work. If you need capacity rather than speed, the rework column is the only one worth reading.
So when the tables below show a process falling from 809 days to 199, that is overwhelmingly a flow and exposure result. It is a real result and worth having — but it is not a headcount argument, and presenting it as one is the fastest way to lose the room.
Want this applied to your own wait? The rubric turns this analysis into advice: describe one wait and it ranks the mechanisms that act on it, using the weights derived below. Run the rubric →
Read this first. These figures are modelled, not measured. Each process is a sample built to be realistic, and the improvement at each level is applied by a rule-based model, not observed in an organisation. Their value is the pattern — where the days come from, which methods move which kind of wait — not the specific numbers. Your own process will differ, and the only way to know by how much is to map it and pull your timestamps.
What the model does
Each maturity step applies a set of named mechanisms to every step of the process, keyed to what that step is waiting on rather than a blanket percentage. Waiting on another team is not fixed the same way as waiting for an approval, and neither is fixed the way a tooling handoff is.
Level
What is done, and to what
Level 3 — Defined
The process leaves people’s heads. A written definition of done, one intake with a stated priority rule, a limit on what is in flight, and a self-service answer to whatever question is causing the longest queue.
Level 4 — Quantitatively Managed
Standard work you can predict. Routine items get a pre-approved class instead of a per-item decision, validation runs against a shared harness, other teams’ queues get a named owner and an age limit, and the same steps are re-measured every month.
Level 5 — Optimizing
The line improves itself. Handoffs automate, telemetry raises its own work items, standing authority replaces per-item escalation, every bounce triggers a short why that is written into the standard, and things that no longer earn their place are retired on evidence.
Calibration. The mechanism strengths are fitted to the one process in the library that exists at all four levels by hand — the detection-engineering line from the Climb walkthrough. Running the model on its level-2 state reproduces the hand-built levels to within 0.5% at level 3, 11% at level 4 and 2% at level 5. The level-4 miss is in the conservative direction: the model claims less improvement than the hand-built version.
What 54 processes showed
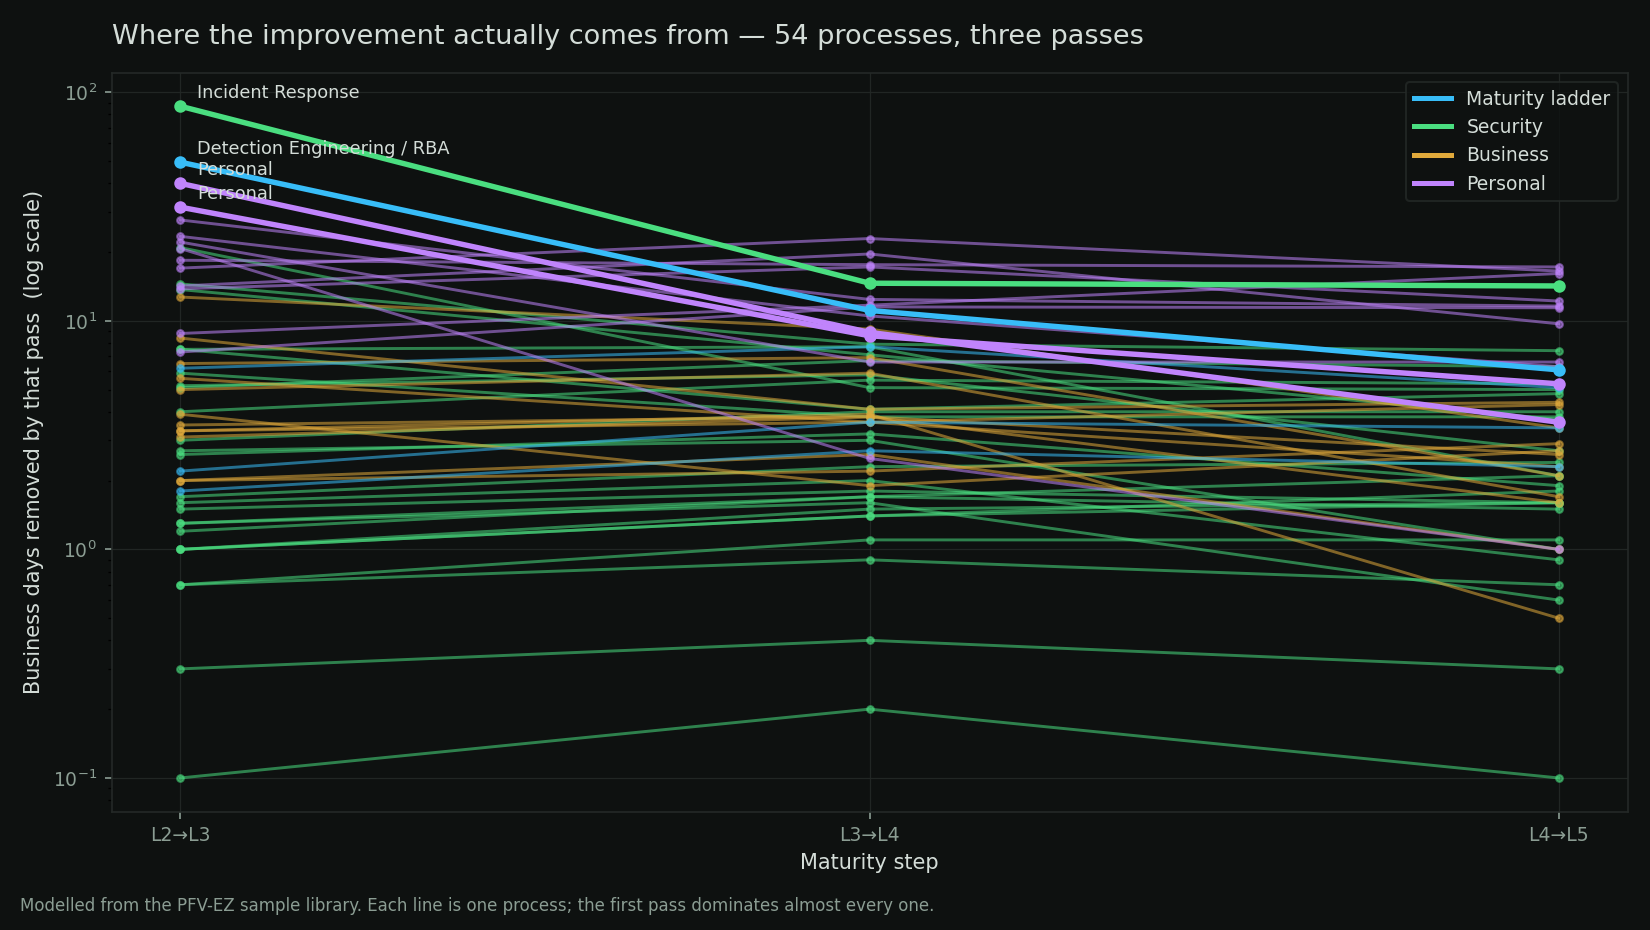
Every process, and the days each pass removed from it. The vertical scale is compressed (each gridline is ten times the one below, so 10⁻¹ is a tenth of a day and 10² is a hundred days) because the library ranges from a 40-minute phishing triage to a 135-day incident-response cycle. The pattern is the point: every process improves at every pass, and the biggest absolute wins are on the processes that were worst to begin with.
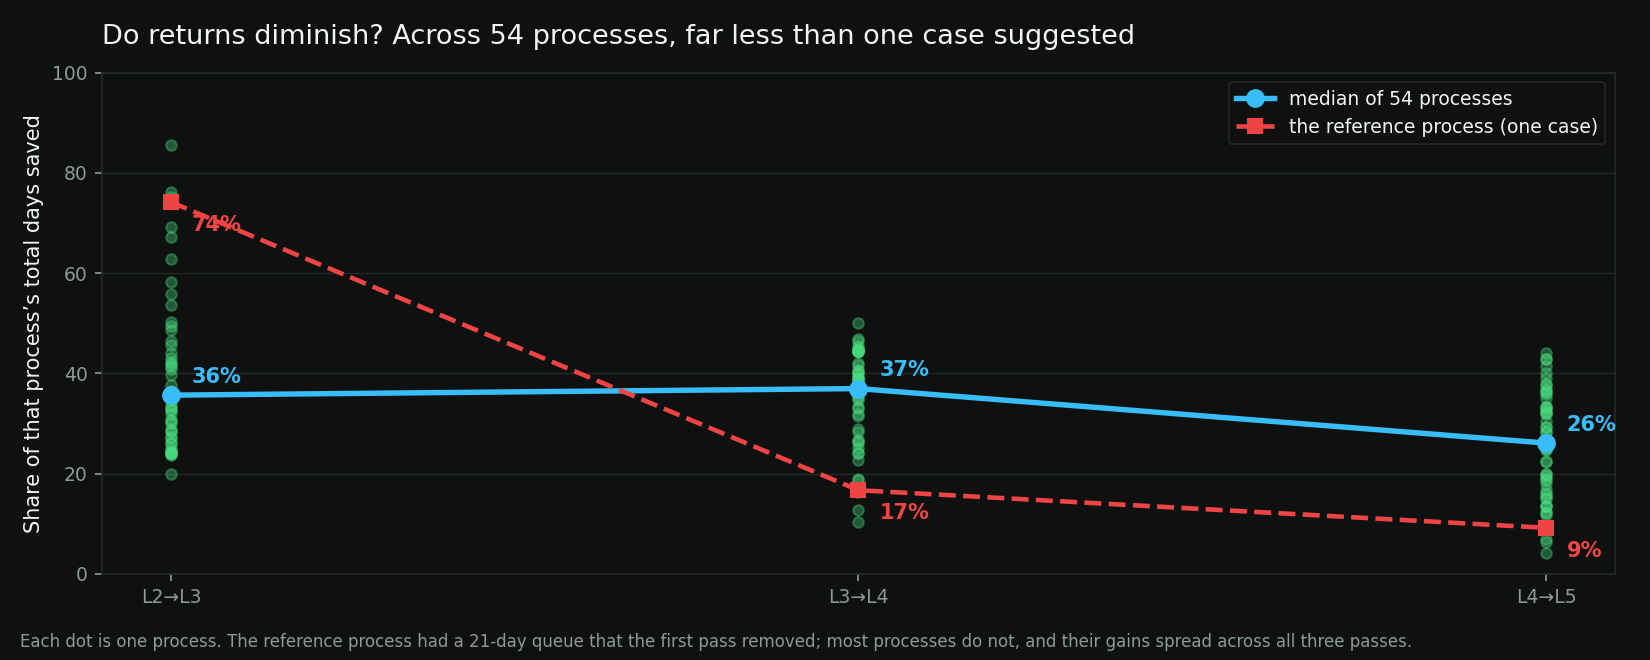
A correction to something I published. Returns diminish sharply pass over pass, based on the one process measured at four levels: it gave 74% of its total win in the first pass, then 17%, then 9%. Across all 54, the median is 36% / 37% / 26% — far flatter. That reference process had a single 21-day queue, and killing it produced an outlier first pass. Sharp diminishing returns are a property of processes with one dominant queue, not a general law. If your waiting is spread evenly, expect your gains to be spread evenly too, and budget for three passes rather than one.
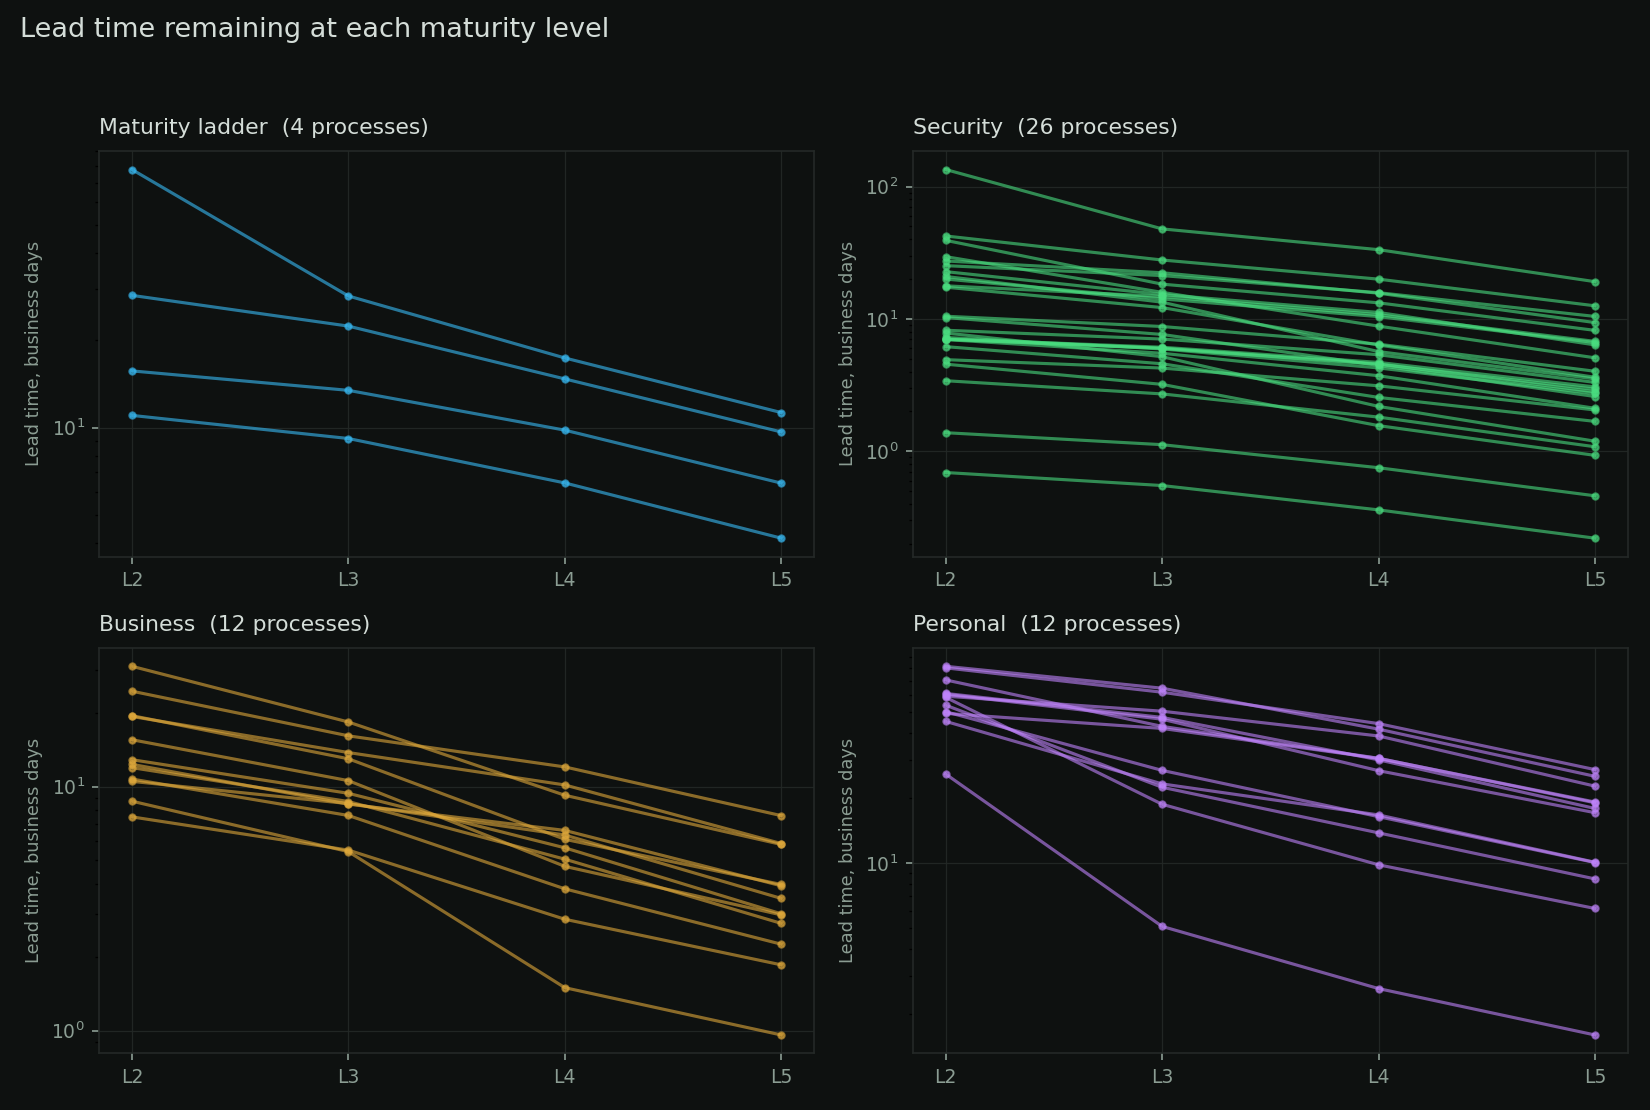
Each dot is one process. The blue line is the median across the library; the dashed red line is the single reference process the earlier claim was built on.Lead time remaining at each level, grouped. Personal processes start worst — they are almost entirely waiting, most of it on a decision — and improve the most in absolute days.
What holds across all of them
Finding
What the 54 showed
The typical process loses about 70% of its lead time
Median reduction from level 2 to level 5 across the library. The range runs from 57% to 94%, and the differences track how much of the elapsed time was waiting in the first place.
Most of it is flow and exposure, not capacity
This is the finding that changes what you may claim. Across the 42 processes, lead time fell 610 days in total — but hands-on work fell only 463 hours, which is 58 days. So under a tenth of the improvement is effort eliminated and therefore capacity returned; the rest is work moving through faster and conditions staying open for less time. Both are worth having. Only the first lets the same people finish more.
And all of the capacity came from one place
Every hour of the 463 is rework that stopped happening. Not one of the mechanisms made anybody faster at their job, and none of them removed a step that was doing useful work. If you need capacity rather than speed, the rework column is the only one worth reading.
Work content barely moves
Hands-on hours fall modestly at levels 4 and 5, almost entirely through rework that stops happening. Nobody in any of these examples works faster. The lead-time reduction is waiting being removed — which shortens the exposure window and the customer’s wait without adding capacity. Capacity comes from the rework, and the queue is usually what was causing the rework.
Every pass still pays
No process in the library exhausted its improvement at level 3. The smallest third-pass gain in the set is still measurable, which is an argument for treating improvement as a standing practice rather than a project.
PCE stays low even at level 5
Most processes finish under 10% process cycle efficiency. That is expected for judgement work: review, coordination and decision time are not waste, and a fully improved process still shows plenty of waiting.
The biggest absolute wins are the worst processes
Incident Response — Detect to Contain (industry) gives back 115.6 days. A process already running well gives back a day or two. Start where the pile is tallest.
The totals, and which method won
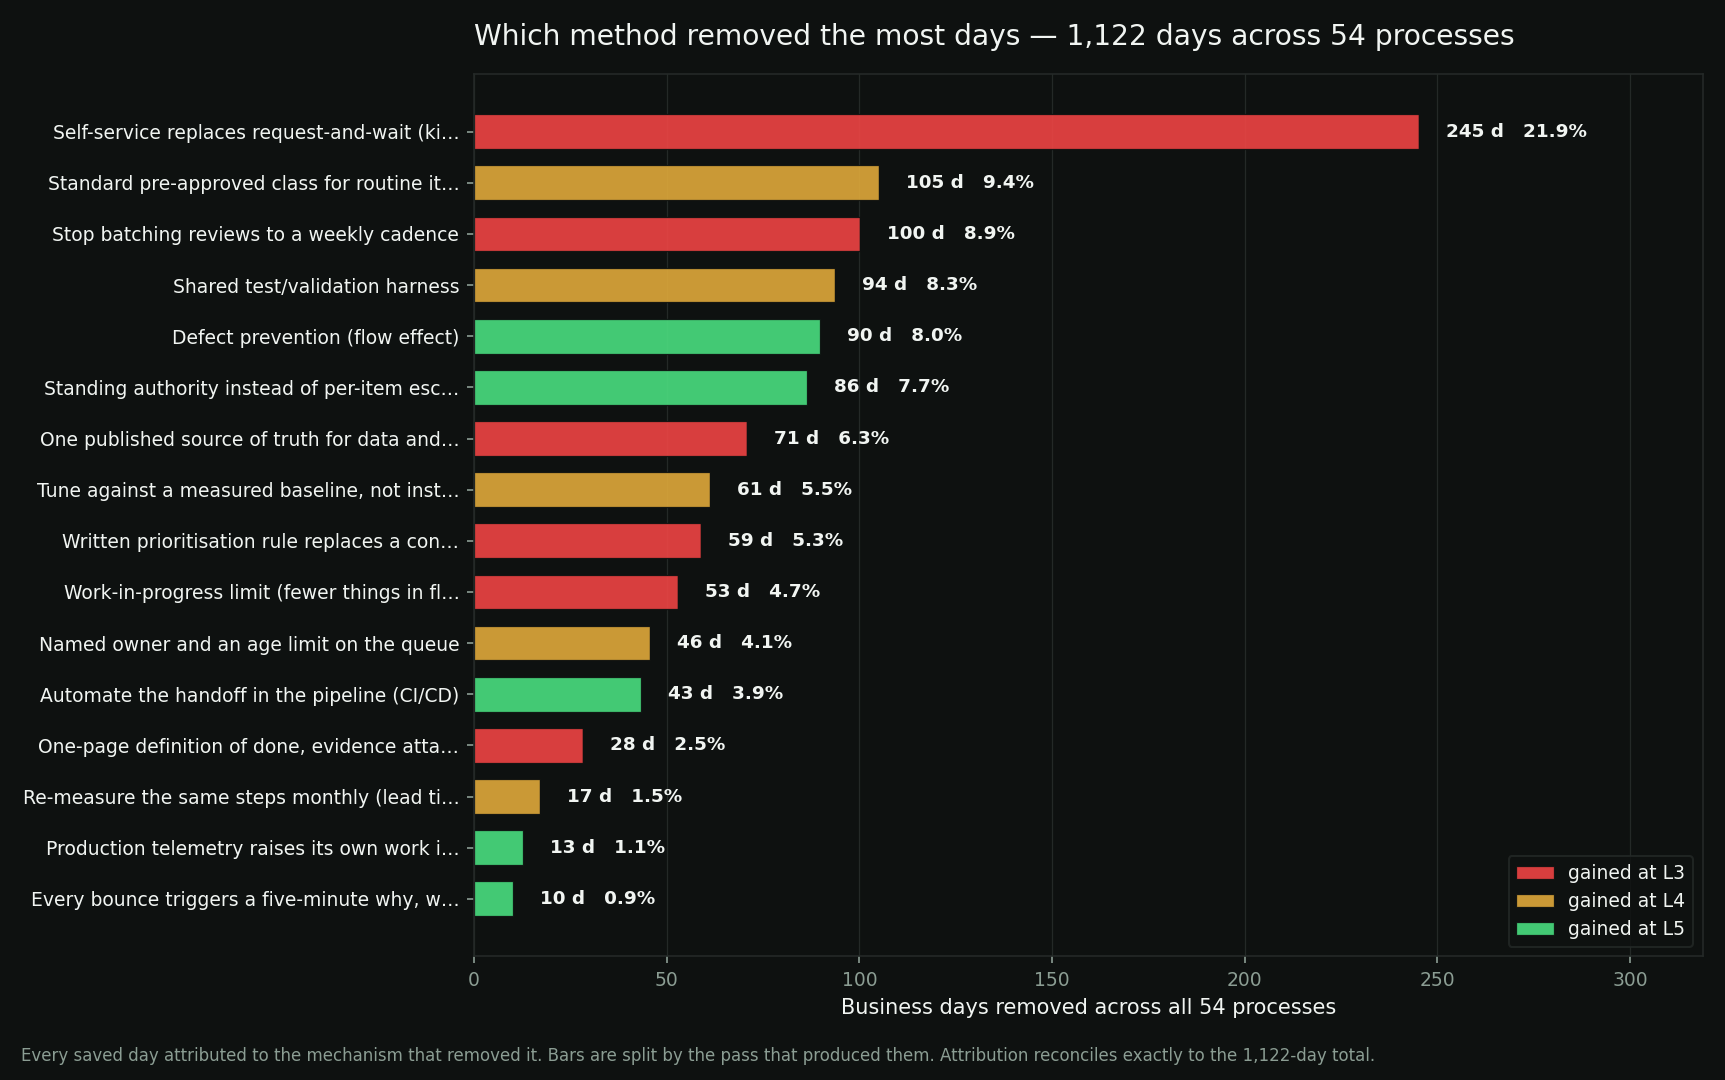
Every one of the 54 processes, summed. Each saved day is attributed to the specific mechanism that removed it, using an exact decomposition of the duration formula — the flow effect goes to the queue mechanism, the quality effect to that level’s defect mechanism, and the two reconcile to the total with no residual.
Across all 54 processes
Business days
Lead time at level 2, summed
1,504.9
Lead time at level 5, summed
382.8
Days removed
1,122.1
Reduction
75.4%
Which pass produced them
Days
Share
Level 2 → 3 standard work
556.6
49.6%
Level 3 → 4 measurement
322.8
28.8%
Level 4 → 5 self-improvement
242.7
21.6%
Every saved day attributed to the method that removed it, with each bar split by the pass that produced it.
Method
Days
Share
Times used
Days each
Self-service replaces request-and-wait (kill the dominant queue)
245.2
21.9%
12
20.43
Standard pre-approved class for routine items
105.1
9.4%
57
1.84
Stop batching reviews to a weekly cadence
100.2
8.9%
28
3.58
Shared test/validation harness
93.7
8.3%
143
0.66
Defect prevention (flow effect)
89.9
8.0%
40
2.25
Standing authority instead of per-item escalation
86.5
7.7%
168
0.51
One published source of truth for data and systems
71.0
6.3%
140
0.51
Tune against a measured baseline, not instinct
61.3
5.5%
40
1.53
Written prioritisation rule replaces a conversation per item
59.0
5.3%
42
1.40
Work-in-progress limit (fewer things in flight)
52.9
4.7%
127
0.42
Named owner and an age limit on the queue
45.6
4.1%
111
0.41
Automate the handoff in the pipeline (CI/CD)
43.5
3.9%
76
0.57
One-page definition of done, evidence attached
28.4
2.5%
—
—
Re-measure the same steps monthly (lead time, PCE, rework, coverage)
17.1
1.5%
—
—
Production telemetry raises its own work items
12.8
1.1%
67
0.19
Every bounce triggers a five-minute why, written into the standard
10.1
0.9%
—
—
The winner, and why it is not the obvious lesson.Self-service replacing request-and-wait removed 245 days — 22% of everything, and it did that from only 12 applications across the whole library: 20.4 days per use, thirty to fifty times the yield of anything else.
It is deliberately the rarest mechanism in the model — it only fires on a queue of ten days or more that also dominates its process. That is the point. One in five of these processes had a single wait big enough to qualify, and killing that one wait was worth more than every other method combined on that process.
The lesson is not “build self-service portals.” It is that the distribution of return is wildly uneven, and finding the one dominant queue matters more than the fix you eventually apply to it. Where no such queue exists, no single method wins — the remaining eleven mechanisms each contribute between 1% and 9%, and the improvement has to be earned in small pieces across three passes.
Two honest caveats on the ranking. First, a mechanism’s total depends on how often the model fires it, so the high-frequency mechanisms (standing authority at 168 uses, shared harness at 143) accumulate meaningful totals from very small per-use gains — look at the days each column, not just the share. Second, the ranking reflects the mechanism strengths fitted to one reference process; a different reference would shift the middle of the table, though not the top of it. The finding that survives either way is the concentration: a small number of enormous queues account for most of the available time.
What if AI did the work instead?
The obvious question, run the same way as everything else on this page: take all 54 processes, replace every human with something that does the work in minutes and never joins a queue, and see what happens to lead time. The answer is not what the framing implies.
How the substitution is modelled. Work and waiting are treated separately, because they have different causes. Each of the 353 steps is classified by what an AI could actually touch:
automatable (59% of steps — analysis, drafting, validation, triage, documentation) gets its work and its queue cut to a twentieth;
accountable (19% — approvals, go/no-go decisions, sign-off) has its work halved because AI prepares the decision, but keeps most of its queue, because a human with a calendar still has to own it;
external (3% — a vendor patch, a payment run, another organisation’s screening) is unchanged, because your side of the process does not set that clock;
physical (3% — attend the appointment, do the repair, have the conversation) is unchanged;
and the remaining human-other (16%) gets partial help. Defects fall sharply on automated work and barely on human decisions.
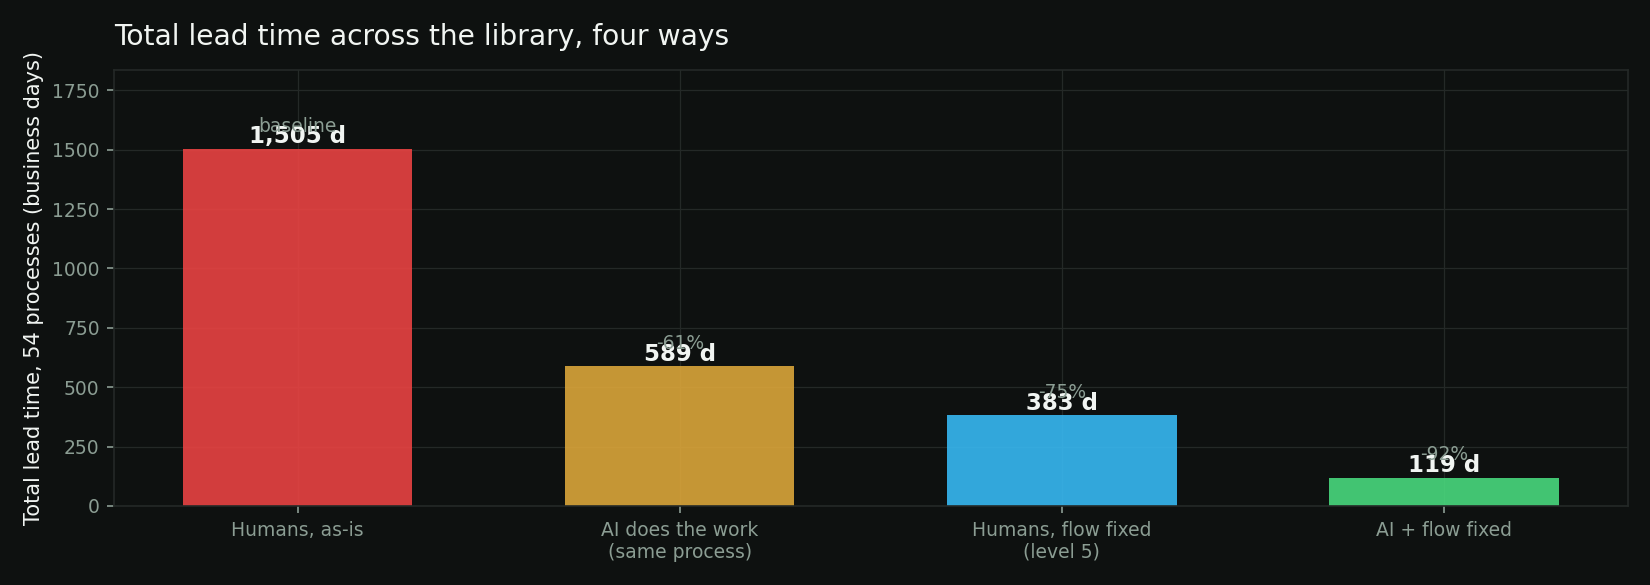
Total lead time across the whole library, four ways.
Scenario
Total lead time
Reduction
Median process
Humans, as-is
809 d
baseline
—
AI does the work — same process
589 d
61%
66%
Humans fix the flow — level 5
383 d
75%
71%
Both
119 d
92%
94%
The headline: AI removes 77% of the work and only 59% of the waiting.
Across the 42 processes, work falls from 579 hours to 116. Waiting falls from 631 days to 214 — and waiting is what lead time is made of.
That is the same arithmetic as everything else on this page, pointed at a newer answer: if one to five percent of elapsed time is somebody working, then making that part instant cannot buy you more than a few percent unless the waiting goes too. It does go, partly, because an AI never sleeps or joins a queue. But every hour that was waiting on an accountable decision, another organisation, or the physical world survives contact with automation completely.
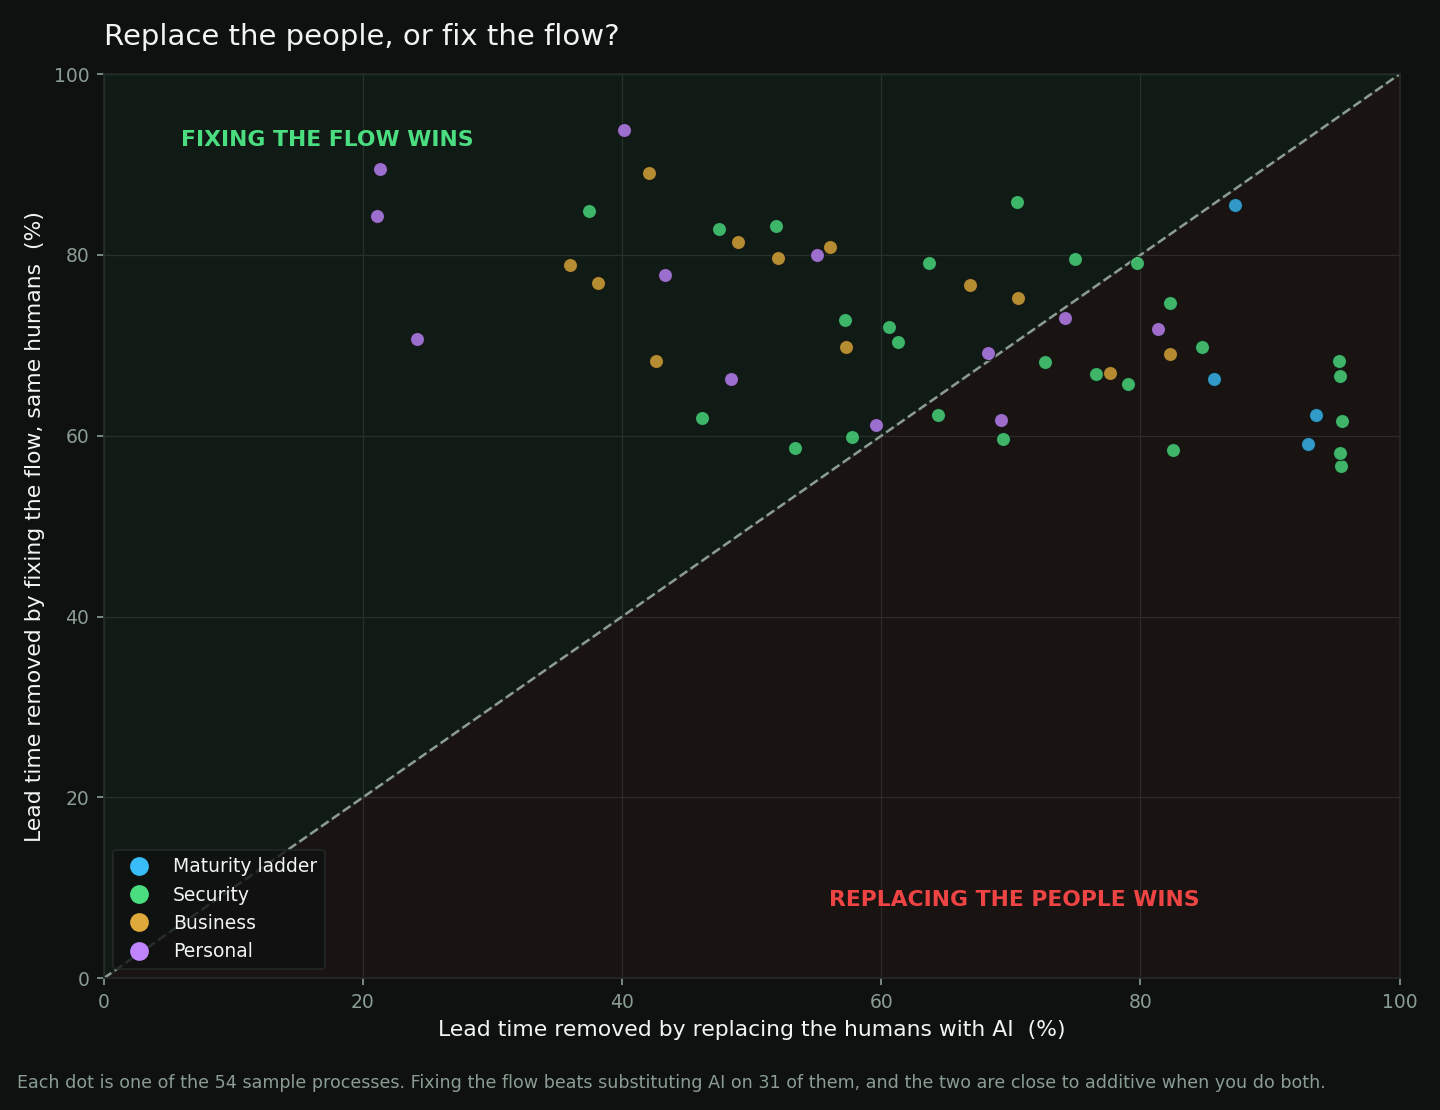
Each dot is one process. Above the diagonal, fixing the flow with the same people wins; below it, substitution wins.
On 31 of the 54 processes, fixing the flow with the same people beat replacing them.
Median reduction is 71% for flow work against 66% for substitution — close, and the flow work costs no licences, no integration, no model risk and no redundancies. It is also available this quarter.
The two are close to additive: doing both reaches 94%, which is roughly what you would expect if they were attacking different things. They are. AI attacks the work; flow design attacks the waiting between it.
Where the answer differs
AI
Flow
Both
n
Security
72%
68%
94%
26
Business
54%
77%
92%
12
Personal
52%
72%
92%
12
Maturity ladder
90%
64%
98%
4
Security work is the most substitutable in this library — it is largely analysis, correlation and documentation, which is exactly what the technology is good at. Business and personal processes are the least, because they are full of approvals somebody has to own, other organisations’ clocks, and things that happen in the physical world. The three processes AI helps most are all detection and triage work (Detection Engineering — One Rule (indust at 96%); the three it helps least are personal ones with a body or another person in them (Declutter one room at 21%).
What this is not. It is not a forecast, and it is certainly not a staffing recommendation. It assumes the technology does the automatable work correctly at a twentieth of the time and cost, which is a generous assumption today and says nothing about supervision, liability, or the rework a wrong answer creates — the model gives AI a lower defect rate on automated work, and if that assumption is wrong the case weakens sharply. What it does show is structural and survives most quibbles about the factors: a process whose delay is mostly waiting will not be rescued by making the work instant. If you are being asked what AI will do to your operation, map the flow first. The map tells you which parts are even eligible.
Improve the constraint, not every step
Before choosing what to change, ask whether the step you are looking at is the one limiting the
process. Usually it is not. A long wait, a slow activity, a critical-path position, a rework source
and an externally owned dependency are five different problems that sometimes coincide, and only
one of them is a constraint.
PFV names a step a likely constraint only where several signals agree: work must be
queuing for that step — the longest wait you own, waiting on a team or an
approval, because waiting on information, a tool or an outside party is a different problem
with a different remedy — and at least two of: rework returning to it, a position on the path
that decides the finish date, or a real share of the hands-on work. Where two steps show equal
evidence it names neither, because naming one would be a guess.
When it does name one, work in this order:
Exploit what it already has. Capacity spent twice on returned work costs nothing to
recover. Time it spends waiting for ready inputs is not a shortage of hours.
Subordinate the rest of the process to it. Release work at the rate it can absorb
rather than at the rate upstream can produce it. Make work complete before it arrives. Use the
queue in front of it for preparation instead of trying to abolish it — that is
hustle while you wait aimed at something specific. Check that finished work does not leave
the constraint straight into another queue.
Elevate it — more people, tooling, outsourcing — and only then. Adding
capacity to a step whose time is going on rework or on waiting for ready work buys the rework and
the waiting too.
Two things worth holding onto. Improving a constraint does not stop it being the
constraint — the next measurement may show the same step still limiting the process, and
that is a real result, not a failure. And an externally owned step cannot be subordinated to: you
cannot align a process to somebody else’s calendar, so that time is contracted, reviewed or
designed around instead.
Then prove it
Improvement does not end when the change is implemented. It ends when the next measurement
either shows the benefit or does not. The full loop is:
What did we observe? What does the measurement actually say — not what we
expected it to say.
Why is it happening? For a wait, PFV records three separate things: Wait is how
long, Waits on is what or whom, Why the wait? is why it exists. For rework, likewise:
Sent back (%) is how often, Sent Back to Step # is where the work returns, and
Why sent back? is why it came back.
What should we change, and what do we expect? Before implementing, write down what is
changing, what problem it addresses, which measurement should move, in which direction, and where
the benefit should appear. An expectation recorded afterwards is not an expectation.
Implement it.
Let it run. Long enough for the numbers to be representative. There is no universal
30, 60 or 90 days — a process that runs twice a month needs longer than one that runs
hourly.
Measure again and compare with the baseline. Same process, same method.
Then read the result honestly. It will be one of four things:
Improved. The expected benefit is visible in the measurement.
Mixed. Some measures improved and others deteriorated. Worth understanding the
trade before standardising it.
No meaningful change. The process did not materially move. The hypothesis was wrong,
or the change was too small to matter, or it did not reach the thing that was actually
constraining the flow.
Worse. The later measurement shows deterioration.
All four are useful. Finding out that an intervention did not work is evidence, and it is
considerably cheaper to learn it from a measurement than from a year of assuming it worked.
How the comparison is actually done
Two ordinary PFV assessments of the same process, captured months apart. Nothing about the
spreadsheet changes — same template, same columns, one file each.
Before you change anything, map the process in the tool and run the analysis. Use
Save this process to a file for the Excel workbook, then File → Save As → CSV
and name it so you will know which it is. Keep it: the tool stores nothing, so that file
is the baseline.
After the change has run long enough for the numbers to be representative, map the same
process again and save that as CSV too.
Keep the step names identical for any step that is still the same step. Steps are paired
on the step name and nothing else — not the number, not the position, not who performs it.
Rename a step between the two captures and it comes back as one step removed and one added, which
is honest but is not a before-and-after. Renumbering and reordering are fine; they are reported as
moved.
Load the later file, run the analysis, then Compare to Baseline, select the
earlier CSV, and Compare Assessments. The comparison appears at the end of the exported
executive report.
The comparison shows what two measurements say. It does not establish that the change
caused the difference — other things move in a business over ninety days. That is why the
expectation gets written down first: a prediction that came true is worth more than a number that
merely moved.
A step can also improve without its clock changing. If work stops coming back —
Sent back (%) falling from 35% to 10%, a reduction of 25 percentage points —
that step has returned capacity to the people doing the work even though its own elapsed time is
identical. That is a real, measurable gain.
The mechanisms, in plain terms
Mechanism
What it actually is
Self-service replaces request-and-wait
Answer the recurring question once, in writing, so you stop re-asking it — the personal-life version
Stop batching reviews to a weekly cadence
Stop saving these up for one big session — the personal-life version
Written prioritisation rule replaces a conversation per item
A standing rule so the choice is made once, not every time you see it — the personal-life version
One published source of truth for data and systems
One place where the information lives — the personal-life version
Work-in-progress limit
Fewer things open at once — the personal-life version
One-page definition of done, evidence attached
Decide what "finished" means before starting — the personal-life version
Standard pre-approved class for routine items
Pre-decide the routine cases — the personal-life version
Shared test/validation harness
A reusable checklist or template — the personal-life version
Named owner and an age limit on the queue
Give it a date, not "soon" — the personal-life version
Tune against a measured baseline, not instinct
Track what actually happened, not what you meant to do — the personal-life version
Re-measure the same steps monthly
Look at the whole list once a month — the personal-life version
Automate the handoff in the pipeline
Automate or delegate the mechanical part — the personal-life version
Production telemetry raises its own work items
Let a reminder raise it instead of your memory — the personal-life version
Standing authority instead of per-item escalation
Stop asking permission you already have — the personal-life version
Every bounce triggers a five-minute why, written into the standard
When something comes back, fix the cause once — the personal-life version
Retire on evidence
Delete what you are never going to do — the personal-life version
Maturity ladder 4 processes
Detection Engineering / RBA — Level 2: Managed (ad hoc)
11 steps · 22.0 h of work inside 77.9 business days · PCE 1.37%
Level
Lead time
Waiting
Work
PCE
Days removed
2 · Managed
77.9 d
66.0 d
22.0 h
1.37%
—
3 · Defined
28.5 d
22.9 d
22.0 h
3.84%
49.4 d
4 · Measured
17.4 d
13.8 d
19.1 h
5.46%
11.1 d
5 · Optimizing
11.3 d
8.8 d
15.7 h
6.90%
6.1 d
66.6 business days removed — 77.9 down to 11.3, a 86% reduction. Work content falls 22.0 h to 15.7 h; the rest was waiting.
Methods used at each level
To level 3
One-page definition of done, evidence attached
Self-service replaces request-and-wait (kill the dominant queue)
One published source of truth for data and systems
Stop batching reviews to a weekly cadence
Work-in-progress limit (fewer things in flight)
To level 4
Tune against a measured baseline, not instinct
Re-measure the same steps monthly (lead time, PCE, rework, coverage)
Standard pre-approved class for routine items
Named owner and an age limit on the queue
Shared test/validation harness
To level 5
Automate the handoff in the pipeline (CI/CD)
Every bounce triggers a five-minute why, written into the standard
Retire on evidence (stop maintaining what no longer earns its place)
Standing authority instead of per-item escalation
Production telemetry raises its own work items
Detection Engineering / RBA — Level 3: Defined
11 steps · 21.5 h of work inside 28.6 business days · PCE 3.67%
Level
Lead time
Waiting
Work
PCE
Days removed
2 · Managed
28.6 d
23.5 d
21.5 h
3.67%
—
3 · Defined
22.4 d
18.2 d
21.5 h
4.68%
6.2 d
4 · Measured
14.7 d
11.7 d
18.5 h
6.17%
7.7 d
5 · Optimizing
9.7 d
7.5 d
15.1 h
7.73%
5.1 d
19.0 business days removed — 28.6 down to 9.7, a 66% reduction. Work content falls 21.5 h to 15.1 h; the rest was waiting.
Methods used at each level
To level 3
One-page definition of done, evidence attached
One published source of truth for data and systems
Stop batching reviews to a weekly cadence
Work-in-progress limit (fewer things in flight)
To level 4
Tune against a measured baseline, not instinct
Re-measure the same steps monthly (lead time, PCE, rework, coverage)
Standard pre-approved class for routine items
Named owner and an age limit on the queue
Shared test/validation harness
To level 5
Automate the handoff in the pipeline (CI/CD)
Every bounce triggers a five-minute why, written into the standard
Retire on evidence (stop maintaining what no longer earns its place)
12 steps · 40.0 h of work inside 42.4 business days · PCE 5.35%
Level
Lead time
Waiting
Work
PCE
Days removed
2 · Managed
42.4 d
29.5 d
40.0 h
5.35%
—
3 · Defined
27.9 d
18.7 d
40.0 h
8.19%
14.5 d
4 · Measured
20.0 d
13.3 d
36.6 h
10.31%
7.9 d
5 · Optimizing
12.6 d
8.3 d
27.4 h
12.10%
7.4 d
29.8 business days removed — 42.4 down to 12.6, a 70% reduction. Work content falls 40.0 h to 27.4 h; the rest was waiting.
Methods used at each level
To level 3
One-page definition of done, evidence attached
One published source of truth for data and systems
Stop batching reviews to a weekly cadence
Work-in-progress limit (fewer things in flight)
To level 4
Re-measure the same steps monthly (lead time, PCE, rework, coverage)
Named owner and an age limit on the queue
Shared test/validation harness
To level 5
Automate the handoff in the pipeline (CI/CD)
Retire on evidence (stop maintaining what no longer earns its place)
Standing authority instead of per-item escalation
Production telemetry raises its own work items
Third-Party / Vendor Risk Review (industry)
5 steps · 8.0 h of work inside 29.6 business days · PCE 1.34%
Level
Lead time
Waiting
Work
PCE
Days removed
2 · Managed
29.6 d
24.6 d
8.0 h
1.34%
—
3 · Defined
15.9 d
13.3 d
8.0 h
2.45%
13.7 d
4 · Measured
8.8 d
7.2 d
7.6 h
4.19%
7.1 d
5 · Optimizing
5.1 d
4.2 d
5.5 h
5.19%
3.7 d
24.5 business days removed — 29.6 down to 5.1, a 83% reduction. Work content falls 8.0 h to 5.5 h; the rest was waiting.
Methods used at each level
To level 3
One-page definition of done, evidence attached
Written prioritisation rule replaces a conversation per item
One published source of truth for data and systems
Stop batching reviews to a weekly cadence
To level 4
Re-measure the same steps monthly (lead time, PCE, rework, coverage)
Standard pre-approved class for routine items
Named owner and an age limit on the queue
Shared test/validation harness
To level 5
Automate the handoff in the pipeline (CI/CD)
Retire on evidence (stop maintaining what no longer earns its place)
Standing authority instead of per-item escalation
Production telemetry raises its own work items
Detection Engineering — Deep Dive (20 tasks)
20 steps · 63.0 h of work inside 27.4 business days · PCE 14.09%
Level
Lead time
Waiting
Work
PCE
Days removed
2 · Managed
27.4 d
16.0 d
63.0 h
14.09%
—
3 · Defined
22.3 d
12.2 d
63.0 h
17.69%
5.1 d
4 · Measured
15.6 d
7.4 d
57.0 h
24.32%
6.7 d
5 · Optimizing
9.4 d
4.4 d
36.7 h
25.86%
6.3 d
18.0 business days removed — 27.4 down to 9.4, a 66% reduction. Work content falls 63.0 h to 36.7 h; the rest was waiting.
Methods used at each level
To level 3
One-page definition of done, evidence attached
Written prioritisation rule replaces a conversation per item
One published source of truth for data and systems
Work-in-progress limit (fewer things in flight)
To level 4
Re-measure the same steps monthly (lead time, PCE, rework, coverage)
Standard pre-approved class for routine items
Named owner and an age limit on the queue
Shared test/validation harness
To level 5
Automate the handoff in the pipeline (CI/CD)
Retire on evidence (stop maintaining what no longer earns its place)
Standing authority instead of per-item escalation
Production telemetry raises its own work items
Change Advisory Board Approval
8 steps · 12.0 h of work inside 20.9 business days · PCE 2.86%
Level
Lead time
Waiting
Work
PCE
Days removed
2 · Managed
20.9 d
17.0 d
12.0 h
2.86%
—
3 · Defined
13.4 d
10.7 d
12.0 h
4.48%
7.5 d
4 · Measured
5.7 d
3.8 d
11.7 h
11.32%
7.7 d
5 · Optimizing
3.5 d
2.2 d
9.0 h
14.33%
2.1 d
17.4 business days removed — 20.9 down to 3.5, a 83% reduction. Work content falls 12.0 h to 9.0 h; the rest was waiting.
Methods used at each level
To level 3
One-page definition of done, evidence attached
Written prioritisation rule replaces a conversation per item
One published source of truth for data and systems
Stop batching reviews to a weekly cadence
Work-in-progress limit (fewer things in flight)
To level 4
Re-measure the same steps monthly (lead time, PCE, rework, coverage)
Standard pre-approved class for routine items
Named owner and an age limit on the queue
Shared test/validation harness
To level 5
Automate the handoff in the pipeline (CI/CD)
Retire on evidence (stop maintaining what no longer earns its place)
Standing authority instead of per-item escalation
Production telemetry raises its own work items
Patch Deployment — Routine Cycle (industry)
5 steps · 2.0 h of work inside 22.8 business days · PCE 0.40%
Level
Lead time
Waiting
Work
PCE
Days removed
2 · Managed
22.8 d
20.5 d
2.0 h
0.40%
—
3 · Defined
15.3 d
14.0 d
2.0 h
0.59%
7.5 d
4 · Measured
11.2 d
10.4 d
1.9 h
0.74%
4.1 d
5 · Optimizing
6.4 d
6.0 d
1.3 h
0.91%
4.8 d
16.4 business days removed — 22.8 down to 6.4, a 72% reduction. Work content falls 2.0 h to 1.3 h; the rest was waiting.
Methods used at each level
To level 3
One-page definition of done, evidence attached
One published source of truth for data and systems
Stop batching reviews to a weekly cadence
Work-in-progress limit (fewer things in flight)
To level 4
Re-measure the same steps monthly (lead time, PCE, rework, coverage)
Named owner and an age limit on the queue
Shared test/validation harness
To level 5
Automate the handoff in the pipeline (CI/CD)
Retire on evidence (stop maintaining what no longer earns its place)
Standing authority instead of per-item escalation
Production telemetry raises its own work items
PFV Mapping Session
10 steps · 40.0 h of work inside 25.3 business days · PCE 8.06%
Level
Lead time
Waiting
Work
PCE
Days removed
2 · Managed
25.3 d
19.0 d
40.0 h
8.06%
—
3 · Defined
21.3 d
15.4 d
40.0 h
9.74%
4.0 d
4 · Measured
15.8 d
10.5 d
39.3 h
13.52%
5.5 d
5 · Optimizing
10.4 d
6.4 d
31.0 h
16.84%
5.3 d
14.8 business days removed — 25.3 down to 10.4, a 59% reduction. Work content falls 40.0 h to 31.0 h; the rest was waiting.
Methods used at each level
To level 3
One-page definition of done, evidence attached
Written prioritisation rule replaces a conversation per item
One published source of truth for data and systems
Work-in-progress limit (fewer things in flight)
To level 4
Re-measure the same steps monthly (lead time, PCE, rework, coverage)
Standard pre-approved class for routine items
Named owner and an age limit on the queue
Shared test/validation harness
To level 5
Automate the handoff in the pipeline (CI/CD)
Retire on evidence (stop maintaining what no longer earns its place)
Standing authority instead of per-item escalation
Production telemetry raises its own work items
DevSecOps Pipeline (Commit → Deploy → Verify)
10 steps · 14.0 h of work inside 17.4 business days · PCE 4.38%
Level
Lead time
Waiting
Work
PCE
Days removed
2 · Managed
17.4 d
12.8 d
14.0 h
4.38%
—
3 · Defined
12.2 d
8.8 d
14.0 h
6.20%
5.2 d
4 · Measured
6.3 d
4.0 d
13.4 h
12.12%
5.8 d
5 · Optimizing
3.6 d
2.2 d
9.1 h
14.44%
2.7 d
13.8 business days removed — 17.4 down to 3.6, a 79% reduction. Work content falls 14.0 h to 9.1 h; the rest was waiting.
Methods used at each level
To level 3
One-page definition of done, evidence attached
Written prioritisation rule replaces a conversation per item
One published source of truth for data and systems
Work-in-progress limit (fewer things in flight)
To level 4
Re-measure the same steps monthly (lead time, PCE, rework, coverage)
Standard pre-approved class for routine items
Named owner and an age limit on the queue
Shared test/validation harness
To level 5
Automate the handoff in the pipeline (CI/CD)
Retire on evidence (stop maintaining what no longer earns its place)
Standing authority instead of per-item escalation
Threat Hunting — One Mission (industry)
5 steps · 20.0 h of work inside 20.0 business days · PCE 5.73%
Level
Lead time
Waiting
Work
PCE
Days removed
2 · Managed
20.0 d
13.7 d
20.0 h
5.73%
—
3 · Defined
14.2 d
9.6 d
20.0 h
8.02%
5.9 d
4 · Measured
10.4 d
6.9 d
18.8 h
10.17%
3.8 d
5 · Optimizing
6.6 d
4.3 d
14.7 h
12.37%
3.8 d
13.4 business days removed — 20.0 down to 6.6, a 67% reduction. Work content falls 20.0 h to 14.7 h; the rest was waiting.
Methods used at each level
To level 3
One-page definition of done, evidence attached
One published source of truth for data and systems
Stop batching reviews to a weekly cadence
Work-in-progress limit (fewer things in flight)
To level 4
Re-measure the same steps monthly (lead time, PCE, rework, coverage)
Named owner and an age limit on the queue
Shared test/validation harness
To level 5
Retire on evidence (stop maintaining what no longer earns its place)
Standing authority instead of per-item escalation
Production telemetry raises its own work items
Alerting & Detection Strategy Framework
9 steps · 20.0 h of work inside 17.8 business days · PCE 6.02%
Level
Lead time
Waiting
Work
PCE
Days removed
2 · Managed
17.8 d
13.0 d
20.0 h
6.02%
—
3 · Defined
14.8 d
10.8 d
20.0 h
7.16%
3.0 d
4 · Measured
10.8 d
7.5 d
20.0 h
10.04%
4.0 d
5 · Optimizing
6.8 d
4.5 d
16.0 h
13.00%
4.0 d
11.0 business days removed — 17.8 down to 6.8, a 62% reduction. Work content falls 20.0 h to 16.0 h; the rest was waiting.
Methods used at each level
To level 3
One-page definition of done, evidence attached
Written prioritisation rule replaces a conversation per item
Work-in-progress limit (fewer things in flight)
To level 4
Re-measure the same steps monthly (lead time, PCE, rework, coverage)
Standard pre-approved class for routine items
Named owner and an age limit on the queue
To level 5
Retire on evidence (stop maintaining what no longer earns its place)
Standing authority instead of per-item escalation
Vulnerability Remediation — Critical (industry)
5 steps · 3.0 h of work inside 10.2 business days · PCE 1.41%
Level
Lead time
Waiting
Work
PCE
Days removed
2 · Managed
10.2 d
8.7 d
3.0 h
1.41%
—
3 · Defined
7.6 d
6.6 d
3.0 h
1.86%
2.6 d
4 · Measured
4.5 d
3.8 d
2.7 h
2.87%
3.2 d
5 · Optimizing
2.6 d
2.3 d
1.8 h
3.26%
1.9 d
7.7 business days removed — 10.2 down to 2.6, a 75% reduction. Work content falls 3.0 h to 1.8 h; the rest was waiting.
Methods used at each level
To level 3
One-page definition of done, evidence attached
Written prioritisation rule replaces a conversation per item
One published source of truth for data and systems
Work-in-progress limit (fewer things in flight)
To level 4
Re-measure the same steps monthly (lead time, PCE, rework, coverage)
Standard pre-approved class for routine items
Named owner and an age limit on the queue
Shared test/validation harness
To level 5
Automate the handoff in the pipeline (CI/CD)
Retire on evidence (stop maintaining what no longer earns its place)
Standing authority instead of per-item escalation
Production telemetry raises its own work items
Security Change Approval (industry)
5 steps · 1.0 h of work inside 7.8 business days · PCE 0.60%
Level
Lead time
Waiting
Work
PCE
Days removed
2 · Managed
7.8 d
7.0 d
1.0 h
0.60%
—
3 · Defined
5.2 d
4.7 d
1.0 h
0.88%
2.7 d
4 · Measured
2.2 d
2.0 d
0.9 h
1.94%
3.0 d
5 · Optimizing
1.2 d
1.1 d
0.7 h
2.54%
1.0 d
6.6 business days removed — 7.8 down to 1.2, a 85% reduction. Work content falls 1.0 h to 0.7 h; the rest was waiting.
Methods used at each level
To level 3
One-page definition of done, evidence attached
Written prioritisation rule replaces a conversation per item
One published source of truth for data and systems
To level 4
Re-measure the same steps monthly (lead time, PCE, rework, coverage)
Standard pre-approved class for routine items
Shared test/validation harness
To level 5
Automate the handoff in the pipeline (CI/CD)
Retire on evidence (stop maintaining what no longer earns its place)
Standing authority instead of per-item escalation
Production telemetry raises its own work items
Detection Engineering — One Rule (industry)
5 steps · 19.0 h of work inside 10.5 business days · PCE 11.19%
Level
Lead time
Waiting
Work
PCE
Days removed
2 · Managed
10.5 d
6.3 d
19.0 h
11.19%
—
3 · Defined
8.8 d
5.2 d
19.0 h
13.26%
1.7 d
4 · Measured
6.4 d
3.6 d
17.3 h
16.64%
2.3 d
5 · Optimizing
4.0 d
2.2 d
12.6 h
19.46%
2.4 d
6.5 business days removed — 10.5 down to 4.0, a 62% reduction. Work content falls 19.0 h to 12.6 h; the rest was waiting.
Methods used at each level
To level 3
One-page definition of done, evidence attached
One published source of truth for data and systems
Work-in-progress limit (fewer things in flight)
To level 4
Re-measure the same steps monthly (lead time, PCE, rework, coverage)
Named owner and an age limit on the queue
Shared test/validation harness
To level 5
Automate the handoff in the pipeline (CI/CD)
Retire on evidence (stop maintaining what no longer earns its place)
Standing authority instead of per-item escalation
Production telemetry raises its own work items
Vulnerability Remediation
5 steps · 12.0 h of work inside 8.2 business days · PCE 8.00%
Level
Lead time
Waiting
Work
PCE
Days removed
2 · Managed
8.2 d
5.8 d
12.0 h
8.00%
—
3 · Defined
7.0 d
4.9 d
12.0 h
9.24%
1.2 d
4 · Measured
5.4 d
3.7 d
10.8 h
10.95%
1.7 d
5 · Optimizing
3.3 d
2.2 d
7.8 h
12.90%
2.1 d
4.9 business days removed — 8.2 down to 3.3, a 60% reduction. Work content falls 12.0 h to 7.8 h; the rest was waiting.
Methods used at each level
To level 3
One-page definition of done, evidence attached
One published source of truth for data and systems
Work-in-progress limit (fewer things in flight)
To level 4
Re-measure the same steps monthly (lead time, PCE, rework, coverage)
Named owner and an age limit on the queue
Shared test/validation harness
To level 5
Automate the handoff in the pipeline (CI/CD)
Retire on evidence (stop maintaining what no longer earns its place)
Standing authority instead of per-item escalation
Production telemetry raises its own work items
AI-Assisted Security Review
10 steps · 12.5 h of work inside 7.0 business days · PCE 9.88%
Level
Lead time
Waiting
Work
PCE
Days removed
2 · Managed
7.0 d
4.8 d
12.5 h
9.88%
—
3 · Defined
5.5 d
3.5 d
12.5 h
12.89%
1.5 d
4 · Measured
3.7 d
2.1 d
11.4 h
18.58%
1.8 d
5 · Optimizing
2.1 d
1.2 d
6.8 h
19.43%
1.6 d
4.9 business days removed — 7.0 down to 2.1, a 70% reduction. Work content falls 12.5 h to 6.8 h; the rest was waiting.
Methods used at each level
To level 3
One-page definition of done, evidence attached
Written prioritisation rule replaces a conversation per item
One published source of truth for data and systems
Work-in-progress limit (fewer things in flight)
To level 4
Re-measure the same steps monthly (lead time, PCE, rework, coverage)
Standard pre-approved class for routine items
Named owner and an age limit on the queue
Shared test/validation harness
To level 5
Automate the handoff in the pipeline (CI/CD)
Retire on evidence (stop maintaining what no longer earns its place)
Standing authority instead of per-item escalation
Production telemetry raises its own work items
SIEM Alert Tuning
5 steps · 16.0 h of work inside 7.2 business days · PCE 14.29%
Level
Lead time
Waiting
Work
PCE
Days removed
2 · Managed
7.2 d
4.0 d
16.0 h
14.29%
—
3 · Defined
5.9 d
3.1 d
16.0 h
17.61%
1.3 d
4 · Measured
4.3 d
1.9 d
15.1 h
24.58%
1.7 d
5 · Optimizing
2.7 d
1.2 d
11.1 h
28.51%
1.5 d
4.5 business days removed — 7.2 down to 2.7, a 62% reduction. Work content falls 16.0 h to 11.1 h; the rest was waiting.
Methods used at each level
To level 3
One-page definition of done, evidence attached
Written prioritisation rule replaces a conversation per item
One published source of truth for data and systems
Work-in-progress limit (fewer things in flight)
To level 4
Re-measure the same steps monthly (lead time, PCE, rework, coverage)
Standard pre-approved class for routine items
Named owner and an age limit on the queue
Shared test/validation harness
To level 5
Automate the handoff in the pipeline (CI/CD)
Retire on evidence (stop maintaining what no longer earns its place)
Standing authority instead of per-item escalation
Production telemetry raises its own work items
Firewall Rule Approvals
5 steps · 9.0 h of work inside 6.2 business days · PCE 7.69%
Level
Lead time
Waiting
Work
PCE
Days removed
2 · Managed
6.2 d
4.5 d
9.0 h
7.69%
—
3 · Defined
4.6 d
3.1 d
9.0 h
10.64%
1.6 d
4 · Measured
2.5 d
1.4 d
8.1 h
19.20%
2.0 d
5 · Optimizing
1.7 d
0.9 d
6.0 h
22.10%
0.9 d
4.5 business days removed — 6.2 down to 1.7, a 73% reduction. Work content falls 9.0 h to 6.0 h; the rest was waiting.
Methods used at each level
To level 3
One-page definition of done, evidence attached
Written prioritisation rule replaces a conversation per item
One published source of truth for data and systems
To level 4
Re-measure the same steps monthly (lead time, PCE, rework, coverage)
Standard pre-approved class for routine items
Shared test/validation harness
To level 5
Automate the handoff in the pipeline (CI/CD)
Retire on evidence (stop maintaining what no longer earns its place)
Standing authority instead of per-item escalation
Production telemetry raises its own work items
Identity & Access Delays
5 steps · 9.5 h of work inside 7.0 business days · PCE 7.69%
Level
Lead time
Waiting
Work
PCE
Days removed
2 · Managed
7.0 d
4.8 d
9.5 h
7.69%
—
3 · Defined
6.0 d
4.1 d
9.5 h
8.80%
1.0 d
4 · Measured
4.6 d
3.0 d
8.8 h
10.73%
1.4 d
5 · Optimizing
2.8 d
1.9 d
6.4 h
12.47%
1.8 d
4.2 business days removed — 7.0 down to 2.8, a 60% reduction. Work content falls 9.5 h to 6.4 h; the rest was waiting.
Methods used at each level
To level 3
One-page definition of done, evidence attached
One published source of truth for data and systems
Work-in-progress limit (fewer things in flight)
To level 4
Re-measure the same steps monthly (lead time, PCE, rework, coverage)
Named owner and an age limit on the queue
Shared test/validation harness
To level 5
Automate the handoff in the pipeline (CI/CD)
Retire on evidence (stop maintaining what no longer earns its place)
Standing authority instead of per-item escalation
Production telemetry raises its own work items
Threat Intelligence
5 steps · 15.0 h of work inside 7.0 business days · PCE 12.82%
Level
Lead time
Waiting
Work
PCE
Days removed
2 · Managed
7.0 d
4.2 d
15.0 h
12.82%
—
3 · Defined
6.0 d
3.5 d
15.0 h
15.08%
1.0 d
4 · Measured
4.5 d
2.4 d
14.1 h
19.41%
1.5 d
5 · Optimizing
2.9 d
1.5 d
10.3 h
22.02%
1.6 d
4.1 business days removed — 7.0 down to 2.9, a 58% reduction. Work content falls 15.0 h to 10.3 h; the rest was waiting.
Methods used at each level
To level 3
One-page definition of done, evidence attached
One published source of truth for data and systems
Work-in-progress limit (fewer things in flight)
To level 4
Re-measure the same steps monthly (lead time, PCE, rework, coverage)
Named owner and an age limit on the queue
Shared test/validation harness
To level 5
Automate the handoff in the pipeline (CI/CD)
Retire on evidence (stop maintaining what no longer earns its place)
Standing authority instead of per-item escalation
Production telemetry raises its own work items
Detection Engineering
5 steps · 20.0 h of work inside 7.1 business days · PCE 19.23%
Level
Lead time
Waiting
Work
PCE
Days removed
2 · Managed
7.1 d
3.5 d
20.0 h
19.23%
—
3 · Defined
6.1 d
2.9 d
20.0 h
22.38%
1.0 d
4 · Measured
4.7 d
2.0 d
18.0 h
26.88%
1.4 d
5 · Optimizing
3.1 d
1.2 d
13.3 h
31.14%
1.6 d
4.0 business days removed — 7.1 down to 3.1, a 57% reduction. Work content falls 20.0 h to 13.3 h; the rest was waiting.
Methods used at each level
To level 3
One-page definition of done, evidence attached
One published source of truth for data and systems
Work-in-progress limit (fewer things in flight)
To level 4
Re-measure the same steps monthly (lead time, PCE, rework, coverage)
Named owner and an age limit on the queue
Shared test/validation harness
To level 5
Automate the handoff in the pipeline (CI/CD)
Retire on evidence (stop maintaining what no longer earns its place)
Standing authority instead of per-item escalation
Production telemetry raises its own work items
Access Provisioning — Joiner (industry)
5 steps · 0.5 h of work inside 4.5 business days · PCE 0.51%
Level
Lead time
Waiting
Work
PCE
Days removed
2 · Managed
4.5 d
4.0 d
0.5 h
0.51%
—
3 · Defined
3.2 d
2.9 d
0.5 h
0.71%
1.3 d
4 · Measured
1.6 d
1.4 d
0.5 h
1.30%
1.6 d
5 · Optimizing
0.9 d
0.9 d
0.3 h
1.53%
0.6 d
3.6 business days removed — 4.5 down to 0.9, a 80% reduction. Work content falls 0.5 h to 0.3 h; the rest was waiting.
Methods used at each level
To level 3
One-page definition of done, evidence attached
Written prioritisation rule replaces a conversation per item
One published source of truth for data and systems
Work-in-progress limit (fewer things in flight)
To level 4
Re-measure the same steps monthly (lead time, PCE, rework, coverage)
Standard pre-approved class for routine items
Named owner and an age limit on the queue
Shared test/validation harness
To level 5
Automate the handoff in the pipeline (CI/CD)
Retire on evidence (stop maintaining what no longer earns its place)
Standing authority instead of per-item escalation
Production telemetry raises its own work items
Incident Escalation
5 steps · 13.0 h of work inside 4.9 business days · PCE 16.46%
Level
Lead time
Waiting
Work
PCE
Days removed
2 · Managed
4.9 d
2.8 d
13.0 h
16.46%
—
3 · Defined
4.2 d
2.3 d
13.0 h
19.33%
0.7 d
4 · Measured
3.1 d
1.5 d
11.4 h
23.93%
1.1 d
5 · Optimizing
2.0 d
0.9 d
8.2 h
26.40%
1.1 d
2.9 business days removed — 4.9 down to 2.0, a 58% reduction. Work content falls 13.0 h to 8.2 h; the rest was waiting.
Methods used at each level
To level 3
One-page definition of done, evidence attached
One published source of truth for data and systems
Work-in-progress limit (fewer things in flight)
To level 4
Re-measure the same steps monthly (lead time, PCE, rework, coverage)
Named owner and an age limit on the queue
Shared test/validation harness
To level 5
Automate the handoff in the pipeline (CI/CD)
Retire on evidence (stop maintaining what no longer earns its place)
Standing authority instead of per-item escalation
Production telemetry raises its own work items
Access Deprovisioning — Leaver (industry)
5 steps · 0.5 h of work inside 3.4 business days · PCE 0.69%
Level
Lead time
Waiting
Work
PCE
Days removed
2 · Managed
3.4 d
3.0 d
0.5 h
0.69%
—
3 · Defined
2.7 d
2.5 d
0.5 h
0.84%
0.7 d
4 · Measured
1.8 d
1.7 d
0.5 h
1.12%
0.9 d
5 · Optimizing
1.1 d
1.0 d
0.3 h
1.30%
0.7 d
2.3 business days removed — 3.4 down to 1.1, a 68% reduction. Work content falls 0.5 h to 0.3 h; the rest was waiting.
Methods used at each level
To level 3
One-page definition of done, evidence attached
One published source of truth for data and systems
Work-in-progress limit (fewer things in flight)
To level 4
Re-measure the same steps monthly (lead time, PCE, rework, coverage)
Named owner and an age limit on the queue
Shared test/validation harness
To level 5
Automate the handoff in the pipeline (CI/CD)
Retire on evidence (stop maintaining what no longer earns its place)
Standing authority instead of per-item escalation
Production telemetry raises its own work items
Alert Triage — One Alert (industry)
4 steps · 0.4 h of work inside 1.4 business days · PCE 1.42%
Level
Lead time
Waiting
Work
PCE
Days removed
2 · Managed
1.4 d
1.2 d
0.4 h
1.42%
—
3 · Defined
1.1 d
1.0 d
0.4 h
1.71%
0.3 d
4 · Measured
0.8 d
0.7 d
0.4 h
2.32%
0.4 d
5 · Optimizing
0.5 d
0.4 d
0.3 h
2.57%
0.3 d
0.9 business days removed — 1.4 down to 0.5, a 67% reduction. Work content falls 0.4 h to 0.3 h; the rest was waiting.
Methods used at each level
To level 3
One-page definition of done, evidence attached
One published source of truth for data and systems
Work-in-progress limit (fewer things in flight)
To level 4
Re-measure the same steps monthly (lead time, PCE, rework, coverage)
Named owner and an age limit on the queue
Shared test/validation harness
To level 5
Automate the handoff in the pipeline (CI/CD)
Retire on evidence (stop maintaining what no longer earns its place)
Standing authority instead of per-item escalation
Production telemetry raises its own work items
Phishing Report Triage (industry)
4 steps · 0.4 h of work inside 0.7 business days · PCE 2.84%
Level
Lead time
Waiting
Work
PCE
Days removed
2 · Managed
0.7 d
0.6 d
0.4 h
2.84%
—
3 · Defined
0.6 d
0.5 d
0.4 h
3.50%
0.1 d
4 · Measured
0.4 d
0.3 d
0.3 h
4.64%
0.2 d
5 · Optimizing
0.2 d
0.2 d
0.2 h
5.26%
0.1 d
0.5 business days removed — 0.7 down to 0.2, a 68% reduction. Work content falls 0.4 h to 0.2 h; the rest was waiting.
Methods used at each level
To level 3
One-page definition of done, evidence attached
One published source of truth for data and systems
Work-in-progress limit (fewer things in flight)
To level 4
Re-measure the same steps monthly (lead time, PCE, rework, coverage)
Named owner and an age limit on the queue
Shared test/validation harness
To level 5
Automate the handoff in the pipeline (CI/CD)
Retire on evidence (stop maintaining what no longer earns its place)
Standing authority instead of per-item escalation
Production telemetry raises its own work items
Business 12 processes
Recruitment — Requisition to Offer (HR)
9 steps · 11.5 h of work inside 31.1 business days · PCE 1.88%
Level
Lead time
Waiting
Work
PCE
Days removed
2 · Managed
31.1 d
25.0 d
11.5 h
1.88%
—
3 · Defined
18.4 d
14.8 d
11.5 h
3.13%
12.7 d
4 · Measured
9.2 d
7.1 d
10.8 h
5.96%
9.2 d
5 · Optimizing
5.8 d
4.5 d
8.0 h
6.88%
3.4 d
25.3 business days removed — 31.1 down to 5.8, a 81% reduction. Work content falls 11.5 h to 8.0 h; the rest was waiting.
Methods used at each level
To level 3
One-page definition of done, evidence attached
Written prioritisation rule replaces a conversation per item
One published source of truth for data and systems
Stop batching reviews to a weekly cadence
Work-in-progress limit (fewer things in flight)
To level 4
Re-measure the same steps monthly (lead time, PCE, rework, coverage)
Standard pre-approved class for routine items
Named owner and an age limit on the queue
Shared test/validation harness
To level 5
Automate the handoff in the pipeline (CI/CD)
Retire on evidence (stop maintaining what no longer earns its place)
Standing authority instead of per-item escalation
Production telemetry raises its own work items
Customer Onboarding — Kickoff to Go-Live (sales ops)
6 steps · 20.0 h of work inside 24.6 business days · PCE 4.31%
Level
Lead time
Waiting
Work
PCE
Days removed
2 · Managed
24.6 d
18.5 d
20.0 h
4.31%
—
3 · Defined
16.1 d
11.9 d
20.0 h
6.53%
8.4 d
4 · Measured
12.0 d
8.6 d
19.7 h
8.69%
4.1 d
5 · Optimizing
7.6 d
5.3 d
15.4 h
10.82%
4.4 d
17.0 business days removed — 24.6 down to 7.6, a 69% reduction. Work content falls 20.0 h to 15.4 h; the rest was waiting.
Methods used at each level
To level 3
One-page definition of done, evidence attached
One published source of truth for data and systems
Stop batching reviews to a weekly cadence
Work-in-progress limit (fewer things in flight)
To level 4
Re-measure the same steps monthly (lead time, PCE, rework, coverage)
Named owner and an age limit on the queue
Shared test/validation harness
To level 5
Automate the handoff in the pipeline (CI/CD)
Retire on evidence (stop maintaining what no longer earns its place)
Standing authority instead of per-item escalation
Production telemetry raises its own work items
Contract Review to Signature (sales)
6 steps · 5.5 h of work inside 19.5 business days · PCE 1.41%
Level
Lead time
Waiting
Work
PCE
Days removed
2 · Managed
19.5 d
16.0 d
5.5 h
1.41%
—
3 · Defined
13.0 d
10.8 d
5.5 h
2.08%
6.5 d
4 · Measured
6.1 d
4.9 d
5.4 h
4.37%
6.9 d
5 · Optimizing
4.0 d
3.2 d
4.2 h
5.15%
2.1 d
15.5 business days removed — 19.5 down to 4.0, a 80% reduction. Work content falls 5.5 h to 4.2 h; the rest was waiting.
Methods used at each level
To level 3
One-page definition of done, evidence attached
Written prioritisation rule replaces a conversation per item
One published source of truth for data and systems
Stop batching reviews to a weekly cadence
Work-in-progress limit (fewer things in flight)
To level 4
Re-measure the same steps monthly (lead time, PCE, rework, coverage)
Standard pre-approved class for routine items
Named owner and an age limit on the queue
Shared test/validation harness
To level 5
Automate the handoff in the pipeline (CI/CD)
Retire on evidence (stop maintaining what no longer earns its place)
Standing authority instead of per-item escalation
Production telemetry raises its own work items
Employee Onboarding — Offer Accepted to Day 1 (HR)
6 steps · 5.8 h of work inside 19.4 business days · PCE 1.48%
Level
Lead time
Waiting
Work
PCE
Days removed
2 · Managed
19.4 d
16.0 d
5.8 h
1.48%
—
3 · Defined
13.8 d
11.7 d
5.8 h
2.01%
5.6 d
4 · Measured
10.2 d
8.7 d
5.6 h
2.62%
3.6 d
5 · Optimizing
5.8 d
5.0 d
4.4 h
3.52%
4.3 d
13.5 business days removed — 19.4 down to 5.8, a 70% reduction. Work content falls 5.8 h to 4.4 h; the rest was waiting.
Methods used at each level
To level 3
One-page definition of done, evidence attached
One published source of truth for data and systems
Stop batching reviews to a weekly cadence
Work-in-progress limit (fewer things in flight)
To level 4
Re-measure the same steps monthly (lead time, PCE, rework, coverage)
Named owner and an age limit on the queue
Shared test/validation harness
To level 5
Automate the handoff in the pipeline (CI/CD)
Retire on evidence (stop maintaining what no longer earns its place)
Standing authority instead of per-item escalation
Production telemetry raises its own work items
Marketing Content — Brief to Publish (marketing)
6 steps · 10.5 h of work inside 15.6 business days · PCE 3.66%
Level
Lead time
Waiting
Work
PCE
Days removed
2 · Managed
15.6 d
11.5 d
10.5 h
3.66%
—
3 · Defined
10.6 d
7.8 d
10.5 h
5.31%
5.0 d
4 · Measured
4.7 d
3.0 d
10.2 h
12.57%
5.9 d
5 · Optimizing
3.0 d
1.8 d
8.0 h
15.72%
1.7 d
12.6 business days removed — 15.6 down to 3.0, a 81% reduction. Work content falls 10.5 h to 8.0 h; the rest was waiting.
Methods used at each level
To level 3
One-page definition of done, evidence attached
Written prioritisation rule replaces a conversation per item
One published source of truth for data and systems
Work-in-progress limit (fewer things in flight)
To level 4
Re-measure the same steps monthly (lead time, PCE, rework, coverage)
Standard pre-approved class for routine items
Named owner and an age limit on the queue
Shared test/validation harness
To level 5
Automate the handoff in the pipeline (CI/CD)
Retire on evidence (stop maintaining what no longer earns its place)
Standing authority instead of per-item escalation
Production telemetry raises its own work items
Invoice Processing — Receipt to Payment (AP)
5 steps · 1.2 h of work inside 12.9 business days · PCE 0.45%
Level
Lead time
Waiting
Work
PCE
Days removed
2 · Managed
12.9 d
11.0 d
1.2 h
0.45%
—
3 · Defined
9.4 d
8.2 d
1.2 h
0.60%
3.5 d
4 · Measured
5.6 d
5.0 d
1.2 h
0.96%
3.8 d
5 · Optimizing
3.0 d
2.8 d
0.8 h
1.25%
2.6 d
9.9 business days removed — 12.9 down to 3.0, a 77% reduction. Work content falls 1.2 h to 0.8 h; the rest was waiting.
Methods used at each level
To level 3
One-page definition of done, evidence attached
Written prioritisation rule replaces a conversation per item
One published source of truth for data and systems
Work-in-progress limit (fewer things in flight)
To level 4
Re-measure the same steps monthly (lead time, PCE, rework, coverage)
Standard pre-approved class for routine items
Named owner and an age limit on the queue
Shared test/validation harness
To level 5
Automate the handoff in the pipeline (CI/CD)
Retire on evidence (stop maintaining what no longer earns its place)
Standing authority instead of per-item escalation
Expense Report — Submit to Reimbursement (finance)
4 steps · 0.8 h of work inside 11.9 business days · PCE 0.34%
Level
Lead time
Waiting
Work
PCE
Days removed
2 · Managed
11.9 d
10.5 d
0.8 h
0.34%
—
3 · Defined
8.7 d
7.8 d
0.8 h
0.45%
3.3 d
4 · Measured
5.0 d
4.6 d
0.8 h
0.70%
3.6 d
5 · Optimizing
2.8 d
2.6 d
0.6 h
0.88%
2.3 d
9.2 business days removed — 11.9 down to 2.8, a 77% reduction. Work content falls 0.8 h to 0.6 h; the rest was waiting.
Methods used at each level
To level 3
One-page definition of done, evidence attached
Written prioritisation rule replaces a conversation per item
One published source of truth for data and systems
Work-in-progress limit (fewer things in flight)
To level 4
Re-measure the same steps monthly (lead time, PCE, rework, coverage)
Standard pre-approved class for routine items
Named owner and an age limit on the queue
Shared test/validation harness
To level 5
Automate the handoff in the pipeline (CI/CD)
Retire on evidence (stop maintaining what no longer earns its place)
Standing authority instead of per-item escalation
Production telemetry raises its own work items
Purchase Requisition to PO Approval (procurement)
5 steps · 2.5 h of work inside 10.7 business days · PCE 1.14%
Level
Lead time
Waiting
Work
PCE
Days removed
2 · Managed
10.7 d
9.0 d
2.5 h
1.14%
—
3 · Defined
7.6 d
6.5 d
2.5 h
1.57%
3.1 d
4 · Measured
3.8 d
3.2 d
2.4 h
2.96%
3.8 d
5 · Optimizing
2.3 d
1.9 d
1.8 h
3.74%
1.6 d
8.5 business days removed — 10.7 down to 2.3, a 79% reduction. Work content falls 2.5 h to 1.8 h; the rest was waiting.
Methods used at each level
To level 3
One-page definition of done, evidence attached
Written prioritisation rule replaces a conversation per item
One published source of truth for data and systems
Work-in-progress limit (fewer things in flight)
To level 4
Re-measure the same steps monthly (lead time, PCE, rework, coverage)
Standard pre-approved class for routine items
Named owner and an age limit on the queue
Shared test/validation harness
To level 5
Automate the handoff in the pipeline (CI/CD)
Retire on evidence (stop maintaining what no longer earns its place)
Standing authority instead of per-item escalation
Production telemetry raises its own work items
Customer Support Ticket — Triage to Resolution (CX)
5 steps · 5.2 h of work inside 12.3 business days · PCE 2.25%
Level
Lead time
Waiting
Work
PCE
Days removed
2 · Managed
12.3 d
9.5 d
5.2 h
2.25%
—
3 · Defined
8.5 d
6.7 d
5.2 h
3.17%
3.9 d
4 · Measured
6.6 d
5.3 d
5.2 h
3.94%
1.9 d
5 · Optimizing
3.9 d
3.2 d
4.1 h
5.15%
2.7 d
8.4 business days removed — 12.3 down to 3.9, a 68% reduction. Work content falls 5.2 h to 4.1 h; the rest was waiting.
Methods used at each level
To level 3
One-page definition of done, evidence attached
One published source of truth for data and systems
Stop batching reviews to a weekly cadence
Work-in-progress limit (fewer things in flight)
To level 4
Re-measure the same steps monthly (lead time, PCE, rework, coverage)
Named owner and an age limit on the queue
Shared test/validation harness
To level 5
Automate the handoff in the pipeline (CI/CD)
Retire on evidence (stop maintaining what no longer earns its place)
Standing authority instead of per-item escalation
Quote to Approval — Deal Desk / CPQ (sales)
5 steps · 3.5 h of work inside 8.7 business days · PCE 2.04%
Level
Lead time
Waiting
Work
PCE
Days removed
2 · Managed
8.7 d
7.0 d
3.5 h
2.04%
—
3 · Defined
5.4 d
4.4 d
3.5 h
3.24%
3.3 d
4 · Measured
1.5 d
1.0 d
3.3 h
12.24%
3.9 d
5 · Optimizing
1.0 d
0.6 d
2.5 h
14.79%
0.5 d
7.8 business days removed — 8.7 down to 1.0, a 89% reduction. Work content falls 3.5 h to 2.5 h; the rest was waiting.
Methods used at each level
To level 3
One-page definition of done, evidence attached
Written prioritisation rule replaces a conversation per item
One published source of truth for data and systems
To level 4
Re-measure the same steps monthly (lead time, PCE, rework, coverage)
Standard pre-approved class for routine items
Shared test/validation harness
To level 5
Automate the handoff in the pipeline (CI/CD)
Retire on evidence (stop maintaining what no longer earns its place)
Standing authority instead of per-item escalation
Production telemetry raises its own work items
Sales Order to Fulfillment Handoff (sales ops)
5 steps · 4.2 h of work inside 10.5 business days · PCE 2.04%
Level
Lead time
Waiting
Work
PCE
Days removed
2 · Managed
10.5 d
8.5 d
4.2 h
2.04%
—
3 · Defined
8.5 d
7.0 d
4.2 h
2.45%
2.0 d
4 · Measured
6.3 d
5.3 d
4.0 h
3.03%
2.2 d
5 · Optimizing
3.5 d
3.0 d
2.5 h
3.41%
2.9 d
7.0 business days removed — 10.5 down to 3.5, a 67% reduction. Work content falls 4.2 h to 2.5 h; the rest was waiting.
Methods used at each level
To level 3
One-page definition of done, evidence attached
One published source of truth for data and systems
Work-in-progress limit (fewer things in flight)
To level 4
Re-measure the same steps monthly (lead time, PCE, rework, coverage)
Named owner and an age limit on the queue
Shared test/validation harness
To level 5
Automate the handoff in the pipeline (CI/CD)
Retire on evidence (stop maintaining what no longer earns its place)
Standing authority instead of per-item escalation
Lead to Opportunity — MQL → SQL → Accepted (sales)
5 steps · 2.5 h of work inside 7.5 business days · PCE 1.67%
Level
Lead time
Waiting
Work
PCE
Days removed
2 · Managed
7.5 d
6.0 d
2.5 h
1.67%
—
3 · Defined
5.5 d
4.5 d
2.5 h
2.21%
2.0 d
4 · Measured
2.9 d
2.3 d
2.3 h
3.90%
2.6 d
5 · Optimizing
1.9 d
1.6 d
1.7 h
4.44%
1.0 d
5.6 business days removed — 7.5 down to 1.9, a 75% reduction. Work content falls 2.5 h to 1.7 h; the rest was waiting.
Methods used at each level
To level 3
One-page definition of done, evidence attached
Written prioritisation rule replaces a conversation per item
One published source of truth for data and systems
Work-in-progress limit (fewer things in flight)
To level 4
Re-measure the same steps monthly (lead time, PCE, rework, coverage)
Standard pre-approved class for routine items
Named owner and an age limit on the queue
Shared test/validation harness
To level 5
Automate the handoff in the pipeline (CI/CD)
Retire on evidence (stop maintaining what no longer earns its place)
Standing authority instead of per-item escalation
Production telemetry raises its own work items
Personal 12 processes
Difficult conversation you keep postponing
5 steps · 2.0 h of work inside 81.6 business days · PCE 0.11%
Level
Lead time
Waiting
Work
PCE
Days removed
2 · Managed
81.6 d
73.0 d
2.0 h
0.11%
—
3 · Defined
64.6 d
59.4 d
2.0 h
0.14%
17.0 d
4 · Measured
41.7 d
39.3 d
1.9 h
0.20%
22.9 d
5 · Optimizing
25.2 d
24.2 d
1.8 h
0.30%
16.5 d
56.4 business days removed — 81.6 down to 25.2, a 69% reduction. Work content falls 2.0 h to 1.8 h; the rest was waiting.
Methods used at each level
To level 3
Decide what "finished" means before starting
A standing rule so the choice is made once, not every time you see it
Fewer things open at once
To level 4
Track what actually happened, not what you meant to do
Look at the whole list once a month
Pre-decide the routine cases
Give it a date, not "soon"
To level 5
When something comes back, fix the cause once
Delete what you are never going to do
Stop asking permission you already have
Symptom to seen and followed up
7 steps · 2.8 h of work inside 80.2 business days · PCE 0.15%
Level
Lead time
Waiting
Work
PCE
Days removed
2 · Managed
80.2 d
76.0 d
2.8 h
0.15%
—
3 · Defined
61.9 d
59.5 d
2.8 h
0.20%
18.4 d
4 · Measured
44.2 d
43.0 d
2.7 h
0.26%
17.6 d
5 · Optimizing
27.1 d
26.4 d
2.4 h
0.38%
17.2 d
53.2 business days removed — 80.2 down to 27.1, a 66% reduction. Work content falls 2.8 h to 2.4 h; the rest was waiting.
Methods used at each level
To level 3
Decide what "finished" means before starting
A standing rule so the choice is made once, not every time you see it
One place where the information lives
Stop saving these up for one big session
Fewer things open at once
To level 4
Track what actually happened, not what you meant to do
Look at the whole list once a month
Pre-decide the routine cases
Give it a date, not "soon"
A reusable checklist or template
To level 5
When something comes back, fix the cause once
Delete what you are never going to do
Stop asking permission you already have
Let a reminder raise it instead of your memory
Role spotted to offer
7 steps · 4.7 h of work inside 58.6 business days · PCE 0.38%
Level
Lead time
Waiting
Work
PCE
Days removed
2 · Managed
58.6 d
51.0 d
4.7 h
0.38%
—
3 · Defined
18.7 d
16.7 d
4.7 h
1.16%
39.9 d
4 · Measured
9.8 d
8.7 d
4.3 h
2.04%
8.9 d
5 · Optimizing
6.1 d
5.5 d
3.5 h
2.60%
3.6 d
52.4 business days removed — 58.6 down to 6.1, a 90% reduction. Work content falls 4.7 h to 3.5 h; the rest was waiting.
Methods used at each level
To level 3
Decide what "finished" means before starting
Answer the recurring question once, in writing, so you stop re-asking it
One place where the information lives
Stop saving these up for one big session
Fewer things open at once
To level 4
Track what actually happened, not what you meant to do
Look at the whole list once a month
Pre-decide the routine cases
Give it a date, not "soon"
A reusable checklist or template
To level 5
Automate or delegate the mechanical part
When something comes back, fix the cause once
Delete what you are never going to do
Stop asking permission you already have
Let a reminder raise it instead of your memory
Idea to published post
6 steps · 5.6 h of work inside 70.5 business days · PCE 0.36%
Level
Lead time
Waiting
Work
PCE
Days removed
2 · Managed
70.5 d
64.0 d
5.6 h
0.36%
—
3 · Defined
42.9 d
39.6 d
5.6 h
0.59%
27.6 d
4 · Measured
30.6 d
28.6 d
4.8 h
0.70%
12.4 d
5 · Optimizing
19.0 d
18.0 d
4.0 h
0.92%
11.6 d
51.5 business days removed — 70.5 down to 19.0, a 73% reduction. Work content falls 5.6 h to 4.0 h; the rest was waiting.
Methods used at each level
To level 3
Decide what "finished" means before starting
Answer the recurring question once, in writing, so you stop re-asking it
One place where the information lives
Fewer things open at once
To level 4
Track what actually happened, not what you meant to do
Look at the whole list once a month
Pre-decide the routine cases
A reusable checklist or template
To level 5
Automate or delegate the mechanical part
When something comes back, fix the cause once
Delete what you are never going to do
Stop asking permission you already have
Let a reminder raise it instead of your memory
Declutter one room
4 steps · 4.6 h of work inside 53.9 business days · PCE 0.41%
Level
Lead time
Waiting
Work
PCE
Days removed
2 · Managed
53.9 d
47.0 d
4.6 h
0.41%
—
3 · Defined
22.4 d
19.6 d
4.6 h
0.97%
31.4 d
4 · Measured
13.8 d
12.3 d
4.1 h
1.37%
8.6 d
5 · Optimizing
8.4 d
7.6 d
3.5 h
1.87%
5.3 d
45.4 business days removed — 53.9 down to 8.4, a 84% reduction. Work content falls 4.6 h to 3.5 h; the rest was waiting.
Methods used at each level
To level 3
Decide what "finished" means before starting
Answer the recurring question once, in writing, so you stop re-asking it
Stop saving these up for one big session
Fewer things open at once
To level 4
Track what actually happened, not what you meant to do
Look at the whole list once a month
Pre-decide the routine cases
To level 5
When something comes back, fix the cause once
Delete what you are never going to do
Stop asking permission you already have
Financial review to action taken
4 steps · 4.1 h of work inside 60.5 business days · PCE 0.33%
Level
Lead time
Waiting
Work
PCE
Days removed
2 · Managed
60.5 d
52.0 d
4.1 h
0.33%
—
3 · Defined
46.4 d
41.0 d
4.1 h
0.42%
14.2 d
4 · Measured
26.8 d
24.1 d
3.5 h
0.60%
19.6 d
5 · Optimizing
17.1 d
15.9 d
2.9 h
0.76%
9.7 d
43.5 business days removed — 60.5 down to 17.1, a 72% reduction. Work content falls 4.1 h to 2.9 h; the rest was waiting.
Methods used at each level
To level 3
Decide what "finished" means before starting
A standing rule so the choice is made once, not every time you see it
One place where the information lives
Fewer things open at once
To level 4
Track what actually happened, not what you meant to do
Look at the whole list once a month
Pre-decide the routine cases
A reusable checklist or template
To level 5
When something comes back, fix the cause once
Delete what you are never going to do
Stop asking permission you already have
Let a reminder raise it instead of your memory
Getting a fitness block started
5 steps · 10.1 h of work inside 61.1 business days · PCE 0.83%
Level
Lead time
Waiting
Work
PCE
Days removed
2 · Managed
61.1 d
50.0 d
10.1 h
0.83%
—
3 · Defined
47.3 d
40.0 d
10.1 h
1.04%
13.8 d
4 · Measured
30.0 d
26.2 d
8.8 h
1.38%
17.2 d
5 · Optimizing
17.9 d
15.9 d
7.5 h
1.93%
12.2 d
43.2 business days removed — 61.1 down to 17.9, a 71% reduction. Work content falls 10.1 h to 7.5 h; the rest was waiting.
Methods used at each level
To level 3
Decide what "finished" means before starting
A standing rule so the choice is made once, not every time you see it
One place where the information lives
Fewer things open at once
To level 4
Track what actually happened, not what you meant to do
Look at the whole list once a month
Pre-decide the routine cases
A reusable checklist or template
To level 5
Automate or delegate the mechanical part
When something comes back, fix the cause once
Delete what you are never going to do
Stop asking permission you already have
Expense claim to money back
6 steps · 1.2 h of work inside 50.2 business days · PCE 0.11%
Level
Lead time
Waiting
Work
PCE
Days removed
2 · Managed
50.2 d
44.0 d
1.2 h
0.11%
—
3 · Defined
26.8 d
23.4 d
1.2 h
0.21%
23.4 d
4 · Measured
16.4 d
14.7 d
1.0 h
0.28%
10.5 d
5 · Optimizing
10.0 d
9.3 d
0.8 h
0.35%
6.3 d
40.2 business days removed — 50.2 down to 10.0, a 80% reduction. Work content falls 1.2 h to 0.8 h; the rest was waiting.
Methods used at each level
To level 3
Decide what "finished" means before starting
Answer the recurring question once, in writing, so you stop re-asking it
One place where the information lives
Stop saving these up for one big session
Fewer things open at once
To level 4
Track what actually happened, not what you meant to do
Look at the whole list once a month
Pre-decide the routine cases
Give it a date, not "soon"
A reusable checklist or template
To level 5
Automate or delegate the mechanical part
When something comes back, fix the cause once
Delete what you are never going to do
Stop asking permission you already have
Let a reminder raise it instead of your memory
Trip idea to booked
5 steps · 4.2 h of work inside 59.3 business days · PCE 0.33%
Level
Lead time
Waiting
Work
PCE
Days removed
2 · Managed
59.3 d
53.0 d
4.2 h
0.33%
—
3 · Defined
50.5 d
46.2 d
4.2 h
0.38%
8.8 d
4 · Measured
38.8 d
36.2 d
3.8 h
0.43%
11.7 d
5 · Optimizing
22.7 d
21.6 d
2.6 h
0.49%
16.1 d
36.6 business days removed — 59.3 down to 22.7, a 62% reduction. Work content falls 4.2 h to 2.6 h; the rest was waiting.
Methods used at each level
To level 3
Decide what "finished" means before starting
One place where the information lives
Fewer things open at once
To level 4
Track what actually happened, not what you meant to do
Look at the whole list once a month
Give it a date, not "soon"
A reusable checklist or template
To level 5
Automate or delegate the mechanical part
When something comes back, fix the cause once
Delete what you are never going to do
Stop asking permission you already have
Course module you paid for
5 steps · 4.9 h of work inside 45.3 business days · PCE 0.52%
Level
Lead time
Waiting
Work
PCE
Days removed
2 · Managed
45.3 d
39.0 d
4.9 h
0.52%
—
3 · Defined
23.2 d
20.4 d
4.9 h
0.99%
22.1 d
4 · Measured
16.7 d
15.0 d
4.2 h
1.16%
6.6 d
5 · Optimizing
10.1 d
9.2 d
3.6 h
1.60%
6.6 d
35.2 business days removed — 45.3 down to 10.1, a 78% reduction. Work content falls 4.9 h to 3.6 h; the rest was waiting.
Methods used at each level
To level 3
Decide what "finished" means before starting
Answer the recurring question once, in writing, so you stop re-asking it
One place where the information lives
Fewer things open at once
To level 4
Track what actually happened, not what you meant to do
Look at the whole list once a month
Pre-decide the routine cases
A reusable checklist or template
To level 5
Automate or delegate the mechanical part
When something comes back, fix the cause once
Delete what you are never going to do
Stop asking permission you already have
Home repair that needs a part
6 steps · 3.4 h of work inside 49.3 business days · PCE 0.31%
Level
Lead time
Waiting
Work
PCE
Days removed
2 · Managed
49.3 d
45.0 d
3.4 h
0.31%
—
3 · Defined
42.0 d
39.0 d
3.4 h
0.36%
7.3 d
4 · Measured
30.5 d
28.8 d
2.9 h
0.42%
11.5 d
5 · Optimizing
19.1 d
18.3 d
2.5 h
0.56%
11.4 d
30.2 business days removed — 49.3 down to 19.1, a 61% reduction. Work content falls 3.4 h to 2.5 h; the rest was waiting.
Methods used at each level
To level 3
Decide what "finished" means before starting
One place where the information lives
Fewer things open at once
To level 4
Track what actually happened, not what you meant to do
Look at the whole list once a month
A reusable checklist or template
To level 5
Automate or delegate the mechanical part
When something comes back, fix the cause once
Delete what you are never going to do
Let a reminder raise it instead of your memory
The email you have been avoiding
5 steps · 0.5 h of work inside 25.8 business days · PCE 0.09%
Level
Lead time
Waiting
Work
PCE
Days removed
2 · Managed
25.8 d
21.0 d
0.5 h
0.09%
—
3 · Defined
5.1 d
4.5 d
0.5 h
0.41%
20.7 d
4 · Measured
2.6 d
2.4 d
0.4 h
0.68%
2.5 d
5 · Optimizing
1.6 d
1.5 d
0.3 h
0.88%
1.0 d
24.2 business days removed — 25.8 down to 1.6, a 94% reduction. Work content falls 0.5 h to 0.3 h; the rest was waiting.
Methods used at each level
To level 3
Decide what "finished" means before starting
Answer the recurring question once, in writing, so you stop re-asking it
Fewer things open at once
To level 4
Track what actually happened, not what you meant to do
Look at the whole list once a month
Pre-decide the routine cases
A reusable checklist or template
To level 5
Automate or delegate the mechanical part
When something comes back, fix the cause once
Delete what you are never going to do
Stop asking permission you already have
Let a reminder raise it instead of your memory
Use at your own risk
Process Flow Visibility is a method and a set of estimating tools, not professional advice.
Every figure it produces is derived from numbers you enter, most of which are estimates. It does not
measure your process, audit your data, or know your business.
Nothing here is legal, financial, security, safety, medical or engineering advice. Do not use
these outputs as the sole basis for any decision that carries operational, financial, regulatory
or safety consequences. Validate anything that matters against your own records and your own
professional judgement.
Provided “as is”, without warranty of any kind, express or implied, including
merchantability, fitness for a particular purpose and non-infringement. To the fullest extent
permitted by law, Don Woodward accepts no liability for any loss or damage — direct, indirect,
incidental, consequential or otherwise — arising from the use of this site, these tools, or any
figure they produce. You use them entirely at your own risk, and you agree to hold the author
harmless for any outcome that follows.
The worked examples are modelled from industry data, not audited case studies.
Named methods and standards are the property of their respective owners and are referenced for
description only; no endorsement or affiliation is implied.